Demos showing real-time access to your boat via VPN
Why use a VPN to access your boatThe demos display what is happening on our boat, SNAFU II. If you are interested in viewing your own boat systems via a VPN, allowing you access to your data in real-time, then please do contact us for details. For further details email Penny at this URL.
All the demos on this site are reading directly from the systems on our boat via 4G. They show monitoring of the batteries and solar panels. The software is free and Open Source. Our own software is downloadable via this site and there are links to other sources you may wish to use (such as SignalK and Grafana).
The software currently supports the more recent Epever MPPT controllers which use Modbus (e.g. the Tracer-AN Series and later models all support Modbus) and, from the NASA range, the BM1 battery monitor with it's proprietary protocol via Bluetooth connectivity.
Skipper's Mate System
Our extensive Skipper's Mate system is still free and Open Source - available from the Downloads page on the web site.
As the result of Brexit trading conditions, we no longer supply hardware.
BatteryWatchdog gauges
Notes on BatteryWatchdog DemoThis demo shows the current amps and volts via the Epever using our own Open Source BatteryWatchdog gauges.
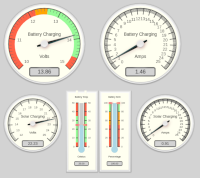
This shows the Battery Monitoring and Solar Monitoring using an Epever Triron via Bluetooth. It shows the actual readings from the Solar Panels and then the input to the battery bank(s) with the benefit of MPPT charging.
SignalK feeds
Notes on SignalK DemoThe demo allows you to view details of the feeds which we have set up using SignalK to integrate our boat systems.
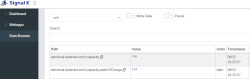
SignalK is an open data format allowing you to utilise the data from a wide range of standard sources. For the purposes of the boat we have, or plan to have, inputs from instruments using NMEA2000, NMEA 0183 and Modbus. Please Google for information about SignalK - it is both clever and complex so we won't be discussing the details here. The Notes on the SignalK Demo are merely there to help you navigate to the feeds we have running.
Grafana graphs - BM1 and Epever
Notes on Grafana DemoThe demo shows the amps and volts recorded via the BM1 and the Epever over a given period - the default is the last 6 hours but longer periods can be displayed, depending on the retention period for the data chosen.
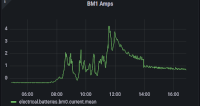
This demo uses the powerful Grafana graphing package (Open Source) and may take a few seconds to load. Once the package is loaded moving between screens should be quite fast.